


TUCSON, Ariz. — It is 5 a.m. MST on Victory Monday, and I am sitting on the balcony with a cup of coffee, looking out at the desert mountainside as the Tucson Mountains begin to emerge from the darkness. The ridgelines are still mostly silhouettes, the sky only starting to lighten, and the desert below is quiet enough to make reflection unavoidable.
In that stillness, I found myself looking back at the work I have been putting in front of the Lions community and asking a harder question than whether I got a prediction right or wrong: Is the analysis fair, useful and worthy of the trust readers place in it?
That kind of self-review is not always comfortable. It is easy to remember the calls that landed and much harder to sit with the ones that missed, but that is the point. If the goal is to provide honest analysis, then the same standard has to apply to my own work. This is a look back at what held up, what did not, and whether the process behind the analysis was as strong as the final result.

WHAT THE PREGAME ANALYSIS GOT RIGHT
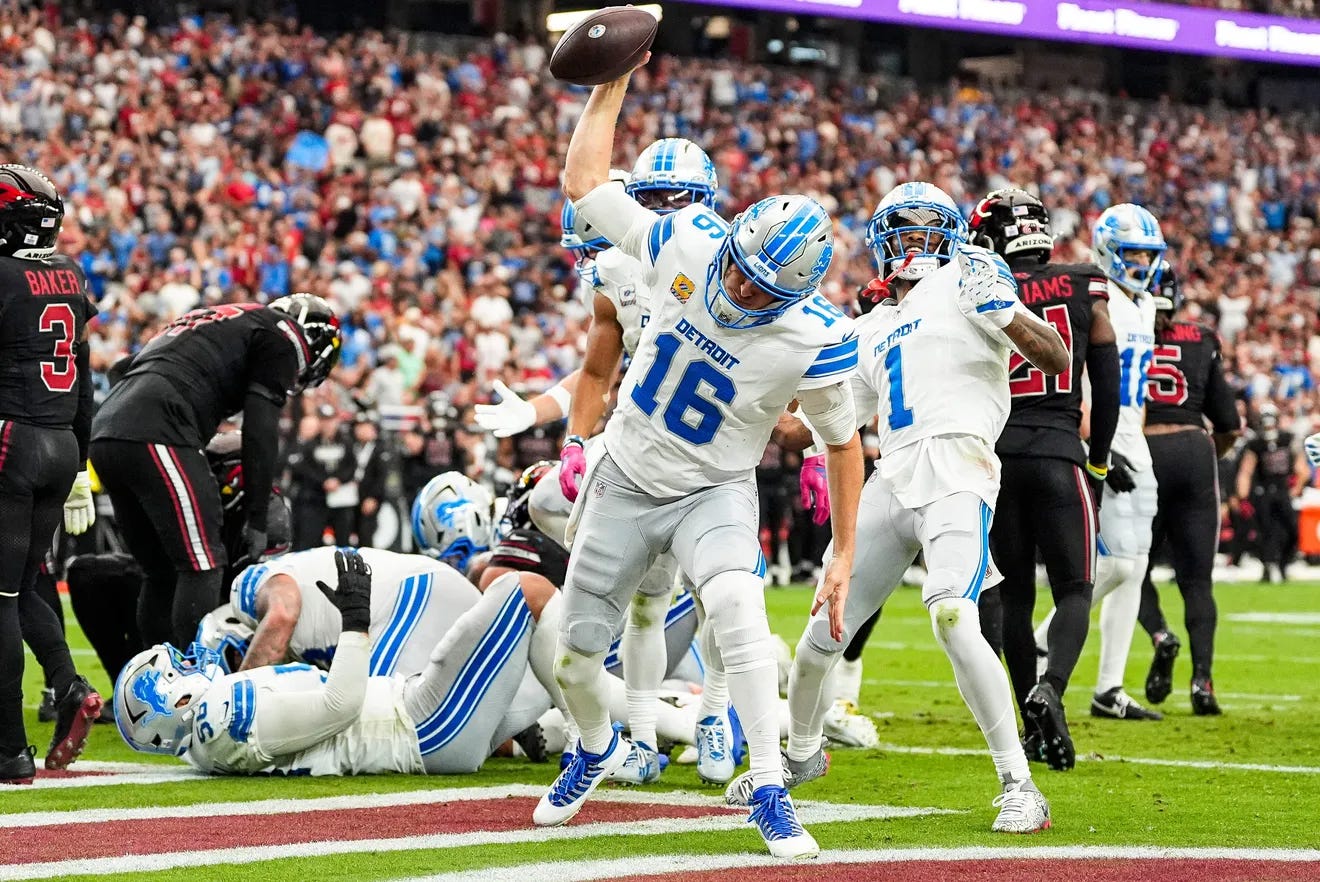
The pregame analysis identified several of the matchup advantages that ultimately shaped Detroit’s 45-21 win. The strongest calls centered on the Lions’ pass-rush edge against Arizona’s rebuilt offensive line, Jared Goff’s opportunity against a vulnerable secondary, Trey McBride’s expected volume, and the likelihood that Detroit’s overall offensive efficiency would create separation. Not every projection landed exactly, but the core matchup reads held up once the game unfolded.
THE OVERALL OFFENSIVE OUTPUT WAS NEARLY DEAD ON
The pregame analysis projected Detroit between 390 and 420 total yards and Arizona between 300 and 330. That proved remarkably accurate, with Detroit finishing almost exactly in the middle of its expected range and Arizona near the top of its own. The larger read also held: the Lions possessed the more efficient offense and enough matchup advantages to create separation, even though the way Detroit generated those yards differed from the expected pass-first path.
Detroit projected: 390-420 total yards
Detroit actual: 412
Arizona projected: 300-330 total yards
Arizona actual: 327
Final score: Lions 45, Cardinals 21
GOFF PUNISHED ARIZONA WITHOUT TURNING THE BALL OVER
The pregame analysis correctly identified Arizona’s pass defense as a favorable matchup for Goff and projected two to three touchdown passes with no more than one interception. Goff did not reach the projected yardage range, but the more important expectation held: once Detroit settled into the game, Arizona could not prevent him from turning scoring opportunities into touchdowns while protecting the football.
Projected passing yards: 295-320
Actual passing yards: 271
Projected touchdowns: 2-3
Actual touchdowns: 3
Projected interceptions: 0-1
Actual interceptions: 0
Passer rating: 125.8
ARIZONA’S OFFENSIVE LINE COULD NOT HANDLE DETROIT’S RUSH
The pregame analysis repeatedly identified Arizona’s rebuilt offensive line as Detroit’s clearest defensive advantage. With Paris Johnson Jr. and Isaiah Adams unavailable, the Cardinals had to protect Brissett with replacement personnel against one of the league’s more productive pressure units, and that concern materialized once Arizona lost its rushing balance.
Detroit sacks: 5
Arizona rushing yards: 56
Jeremiyah Love: 12 carries, 22 yards
Brissett pass attempts: 47
Brissett interceptions: 1
MCBRIDE WAS THE VOLUME THREAT EXPECTED
The pregame analysis identified McBride as Arizona’s primary receiving threat and expected Harrison’s absence to concentrate the passing game even further through him. That happened almost exactly as projected. Detroit did not eliminate McBride, but it kept his high-volume usage from becoming explosive enough to control the game or consistently rescue Arizona on possession downs.
Projected receptions: 8-10
Actual receptions: 9
Projected yards: 70-90
Actual yards: 66
Projected touchdowns: 1
Actual touchdowns: 1
JAMESON WILLIAMS CREATED THE EXPLOSIVE PROBLEM EXPECTED
The pregame analysis specifically identified Williams against Arizona’s secondary as a matchup Detroit should test vertically. His volume was minimal, but his impact was enormous, with both catches becoming touchdowns. The central matchup read was correct: Arizona could not afford to lose leverage against Williams because one mistake could immediately turn into points.
Receptions: 2
Receiving yards: 47
Touchdowns: 2
Long reception: 39 yards
Both receptions produced touchdowns
WHAT THE PREGAME ANALYSIS GOT WRONG
THE RUN GAME—NOT THE PASS—BECAME DETROIT’S PRIMARY ADVANTAGE
The biggest miss was identifying Arizona’s pass defense as the clearest path to controlling the game while treating the rushing attack as the secondary option. Detroit ultimately won with considerably more balance than anticipated, and Gibbs became the centerpiece once the offense recovered from its disastrous first quarter. Arizona’s relative statistical strength against the run never materialized.
Lions rushing yards: 163
Lions rushing attempts: 32
Gibbs rushing yards: 151
Gibbs yards per carry: 6.0
Gibbs scrimmage yards: 207
Goff attempts: 30
GIBBS’ PROJECTION WAS FAR TOO CONSERVATIVE
The pregame projection recognized Gibbs’ receiving value but substantially underestimated what he would produce on the ground. Arizona’s stronger early-season run-defense numbers led to a 70-to-85-yard rushing projection, but Gibbs nearly doubled the low end and became the foundation of Detroit’s offensive recovery.
Projected carries: 16-19
Actual carries: 25
Projected rushing yards: 70-85
Actual rushing yards: 151
Projected scrimmage yards: 105-130
Actual scrimmage yards: 207
Projected touchdowns: 1
Actual touchdowns: 2
LOVE NEVER BECAME THE RUNNING THREAT EXPECTED
The pregame analysis projected Love for 60-to-75 rushing yards and viewed his speed as Arizona’s best way to prevent Detroit from focusing completely on McBride and the short passing game. That never developed, as Detroit’s defensive front consistently controlled Arizona before Love could reach the second level.
Projected carries: 14-17
Actual carries: 12
Projected rushing yards: 60-75
Actual rushing yards: 22
Actual yards per carry: 1.83
Arizona team rushing yards: 56
BRISSETT PRODUCED MORE THROUGH THE AIR THAN PROJECTED
The pregame analysis expected Arizona’s offensive-line problems to hold Brissett closer to 220-to-250 passing yards with one or two touchdowns. Detroit’s pressure advantage was real, but Brissett still accumulated considerably more passing production once game state forced Arizona into 47 attempts and the Lions prioritized preventing explosive scores.
Projected passing yards: 220-250
Actual passing yards: 292
Projected touchdowns: 1-2
Actual touchdowns: 3
Projected interceptions: 1
Actual interceptions: 1
Projected sacks taken: 3-4
Actual sacks taken: 5
ST. BROWN’S VOLUME WAS LOWER THAN EXPECTED
The pregame analysis projected Arizona’s zone-heavy coverage to create steady underneath opportunities for St. Brown, with seven to nine receptions, 80-to-100 yards and a touchdown. He remained productive, but Detroit did not need to funnel the passing game through him because LaPorta, Williams and Gibbs all supplied meaningful production.
Projected receptions: 7-9
Actual receptions: 6
Projected receiving yards: 80-100
Actual receiving yards: 69
Projected touchdowns: 1
Actual touchdowns: 0
Detroit players with at least 47 receiving yards: 4